 Disclaimer: While an investment in managed futures can help enhance returns and reduce risk, it can also do just the opposite and in fact result in further losses in a portfolio. In addition, studies conducted of managed futures as a whole may not be indicative of the performance of any individual CTA. The results of studies conducted in the past may not be indicative of current time periods. Managed futures indices such as the IASG CTA Index do not represent the entire universe of all CTAs. Individuals cannot invest in the index itself. Actual rates of return may be significantly different and more volatile than those of the index.
For the month of May net performance for all accounts including the Navigator Fund L.P. gained 1.30%, 2.60% year to date (“YTD”), while YTD gross returns are 3.7% Vs 4.05% for the S&P. The HFRI Equity Hedge Fund Index lost –0.06% on the month and is lower year to date by -0.25%. The HFRI Hedge Fund Index gained 0.45% and is higher year to date by 0.83%. Assets under management along with proprietary funds are roughly at $61 million with $28 million in the Goldman Navigator Fund L.P.
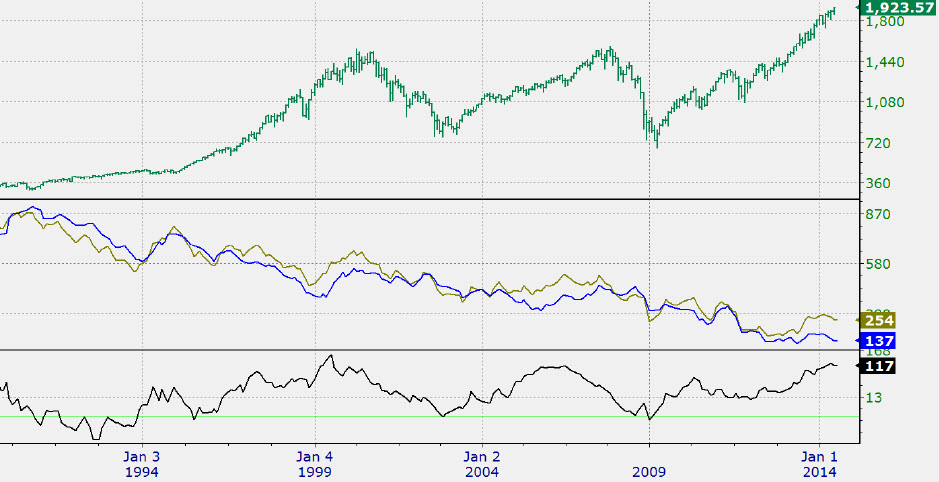
One of the biggest surprises this year has been the sharp decline in long term interest rates despite the Federal Reserve’s monthly removal of $10 billion in bond purchases to gradually reduce quantitative easing. Numerous market commentators have put forth explanations for the rate decline, touching on short covering, limited supply, economic woes, weather etc. A factor which has only been partly discussed is the correlation between European rates and US rates, especially the link between the German Bund and the US 10- year Treasury. These two have been loosely tethered to one another for more than 25 years. In the last sovereign debt crisis during the summer of 2012 Italian and Spanish long term rates stood at 7%, and have since dramatically declined, ending last year yielding 4.1%. This year rates have fallen further with both of these rates just under 3% by month’s end for an additional 110 basis point decline. In the US our 10-year Treasury ended last year yielding 3.02% while German rates closed the year with a 1.8% yield. At month’s end the German Bund was yielding 1.35% for a 45 basis point decline with the US rate dropping by an almost equal amount. The chart on the next page captures almost 25 years from 1990 to the present and portrays the S&P 500 Vs the yields on the US 10 – year Treasury (green) Vs the German Bund (blue). The bottom chart depicts the spread between these two rates. In the global search for yield the strong correlation may have been benefited holders of US bonds. As depicted in the chart, the spread between these two rates is little changed this year and the correlation between these two remains intact. Also worth noting, during times of stress this spread has inverted to below -35 basis points (as low as -65 basis point in January 2009’s flight to quality) and during prior stock market bottoms in 1990 and in 2002 a reading below -35 basis points has occurred near favorable entry points for equities based on an intermediate outlook. Past performance is not necessarily indicative of future results.
Stock prices finished the first five months of the year in a relatively modest range. From the lows of February 3rd to the recent highs amounts to 10.5% with a YTD gain of roughly 4%. Reviewing past periods where the trading range in the first five months of the year was under 11% and year to date gains were under 7% by the end of May reveals only seven other times since 1951, or just 11% of the periods. The three most recent occurrences prior to last were May 2011, May 2006 and May 1993. All of these periods occurred approximately three years after the inception of a bull market or after substantial market gains. This most recent period did not start after the end of a bear market, which by definition is after a 20% decline in the S&P, since the market decline in 2011 was halted after a 19.4% drubbing ending on October 3rd. Lastly, regarding trading ranges, the S&P’s range in the past 13 weeks ending in the third week in May was limited to 5% – a measure of suppressed volatility that has not occurred in eight years or since May 2006.
A little more than a month ago short term modest defensive posturing was implemented and as mentioned last month this was first time in over a year and a half. In the past few weeks a few intermediate indicators registered buy signals and although the predictive power of these signals is not precise in the short term, in our opinion they may have cushioned the market’s declines. The modest defensive posturing led to a small underperformance vs. the S&P in May. The S&P’s trading range was extremely compressed in the first three weeks of the month at roughly 1%, limiting trading opportunities. Returning from the Memorial Day holiday we saw a new high in the German DAX (and a 1.6% advance), which then led to the bulk of the S&P gains in the last four trading sessions of the month. Based on a universe of 1,700 issues the average stock underperformed the S&P last month by a 2:1 margin as momentum and many growth stocks struggled, which may have led to fractional losses from the data on HFRI Equity Hedge Funds.