Disclaimer: While an investment in managed futures can help enhance returns and reduce risk, it can also do just the opposite and in fact result in further losses in a portfolio. In addition, studies conducted of managed futures as a whole may not be indicative of the performance of any individual CTA. The results of studies conducted in the past may not be indicative of current time periods.
We had an interesting conversation with an extremely sophisticated allocator recently. He asked, given that you have had a good run with a long gold position this year, with large open profits, how much will you lose if it reverses hard and you are stopped out at lower levels?”. It’s a question that gets to the heart of trading, and ultimately deals with the difference between what’s known as open equity and closed equity.
Open trade equity (OTE) = cash + margin backing up existing positions + unrealized profits/losses on existing open contract positions
Closed equity = free cash + equity after existing positions have been closed
The answer to the allocator’s question when we were carrying our full gold position is 6-7%. That may surprise some people, given that we try very hard to only risk 1-2% of closed equity when we initiate a new position. But in classical macro trading, the key to putting up great long-term results is to be willing to press your best ideas, and in order to do so, you must be willing to tolerate larger drawdowns and potential losses on OTE. Let’s look at this from a visual perspective. The following is a stylized sketch of a successful trade. It’s completely made up but is close to how these things work in reality.
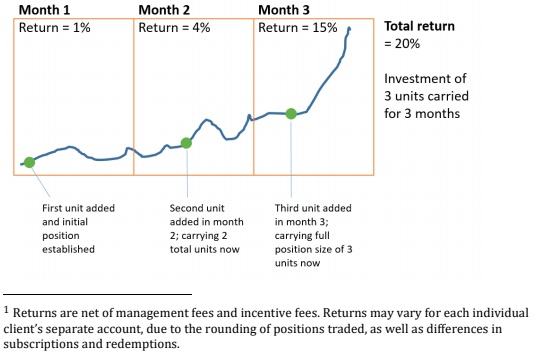
In this example we initiate a position early in month 1, add to it in month 2, and again in month 3, before liquidating the entire position at the end of month 3. The total investment yields 20% (ignoring compounding), but the bulk of the return occurs in month 3 for two reasons: first, markets tend to move slowly much of the time and then in sharp bursts, so successful positions will normally book the majority of their profits in a short period of time. Second, we have our largest position size built up right before the market makes its large move – this was done to minimize our risk but exacerbates the return dispersion and contributes to the ‘lumpiness’ of the returns.
Importantly, a drawdown in the weeks after the first unit was added might only result in a 1% loss (stopped out), but a drawdown in the second half of the third month, after all three units are in place, might result in the 6-7% loss we mentioned at the top of this letter. You cannot have it both ways: you cannot always control risk to a 1% loss and look to leverage a core theme and compound capital at a generous rate. Unlike private equity (which suffers drawdowns of 50-80%
but that are masked by “friendly” and smoothed, slow-moving mark-to-market valuations), our P&L gets shown to the world daily. But there’s no hiding from the actual drawdowns in either case. Only a very short hold time strategy with a high win rate can overcome the need to tolerate open equity losses, and these are hard to find and even harder to sustain on a multi-decade horizon.
AG Capital is a fundamental, long/short macro investment firm, trading across currencies, commodities, interest rates, and equity futures.
The firm follows a fundamentally-oriented, discretionary long/short macro investing. We look for opportunities where imbalance between supply, demand, and inventories (where applicable) may lead to a large price move. Position hold times vary from 1 month to years; no day-trading, no algorithmic trading. Fundamental analysis is used to determine directional exposure, both long and short. Technical analysis is used to determine trade timing: enter and exit positions where extreme asymmetry exists from a risk/reward standpoint.