
Commentary by John Knott of Numberline Capital Partners.
The Numberline Macro Risk Program was down .35% net of all fees for the month of September and is up 25.09% year to date. Additionally, the program has returned 25.32% over the previous 12 months. These numbers are compiled by Turnkey Trading Partners. Last month we left off feeling a little bullish as the market was breaking out to new all-time highs at the end of the month. That always comes with a caveat, when the data changes, so do we. As John Maynard Keynes once famously said, “when the facts change, I change my mind, what do you do sir?” Well, the data changed quickly. That moved us into risk-off mode. The S&P has now pulled back 4.5% from the highs and the Nasdaq 6.5% We will break down the usual models below and provide a summary of risk going forward.
Economic Outlook
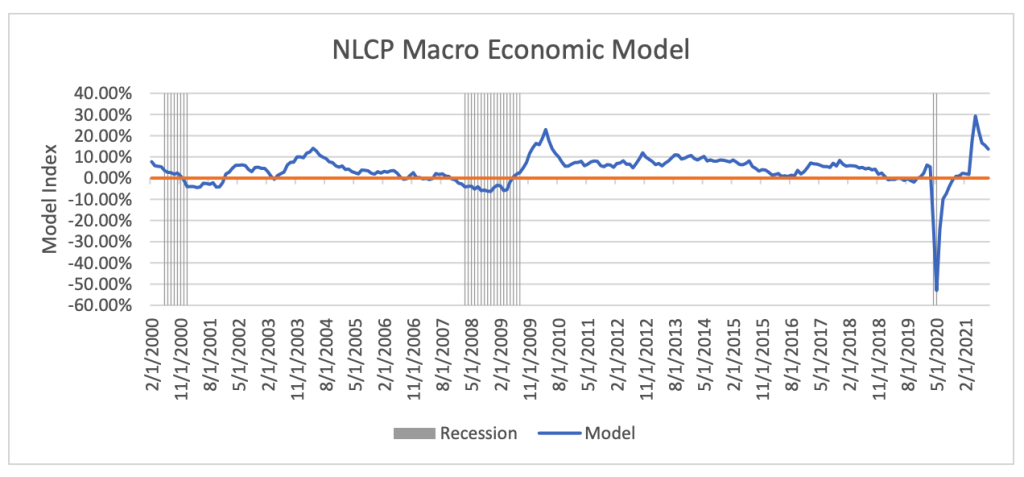
This month’s reading on our macro model dropped from 15.43% to 13.64%. This will continue to slide lower as we move into mid-cycle. That is very normal. Mid-cycle usually begins to show slower economic growth where the model will flirt with going negative. Usually, we see some policy response from the Fed that gives the cycle one last push as we move into late-cycle and then ultimately recession. Important to note, we are moving very quickly through this cycle, much faster than normal due to the Covid response. What usually takes about 7 years to get through a complete cycle might play out over 3 years. This is why we track this data. To get a feel for how far along we are. This informs us of our risk tolerance and optimal hedging strategies.
Volatility Outlook
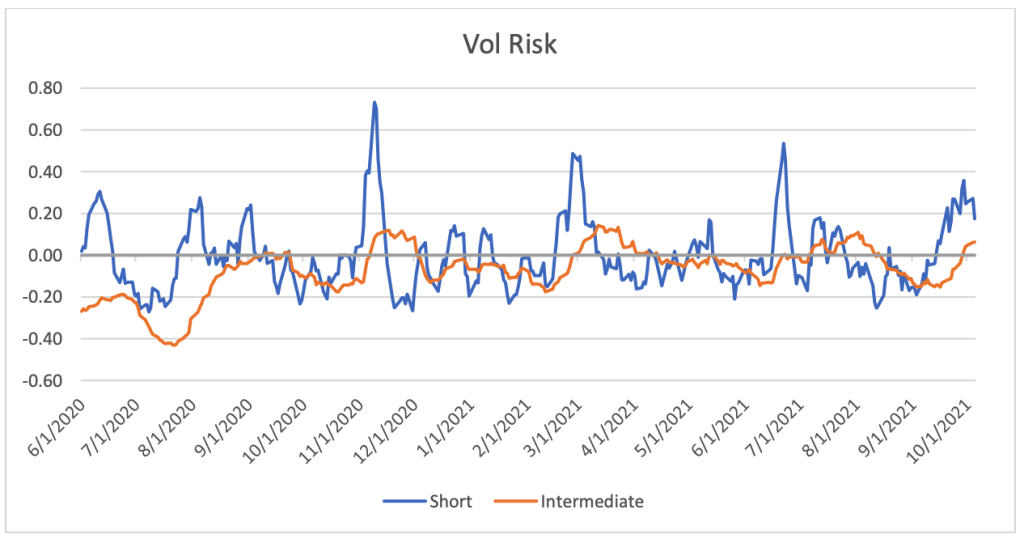
So, this is where the kitchen fire started. Our vol models spiked around the 2nd week of the month. This was caused by the spike in rates and the bid in the Dollar. We were not expecting this. When we encounter data that is contrary to what we are expecting, that’s always important. As you can see this data is still elevated in both the short and intermediate-term. It’s likely the volatility we are experiencing is not over yet.
Technical Outlook
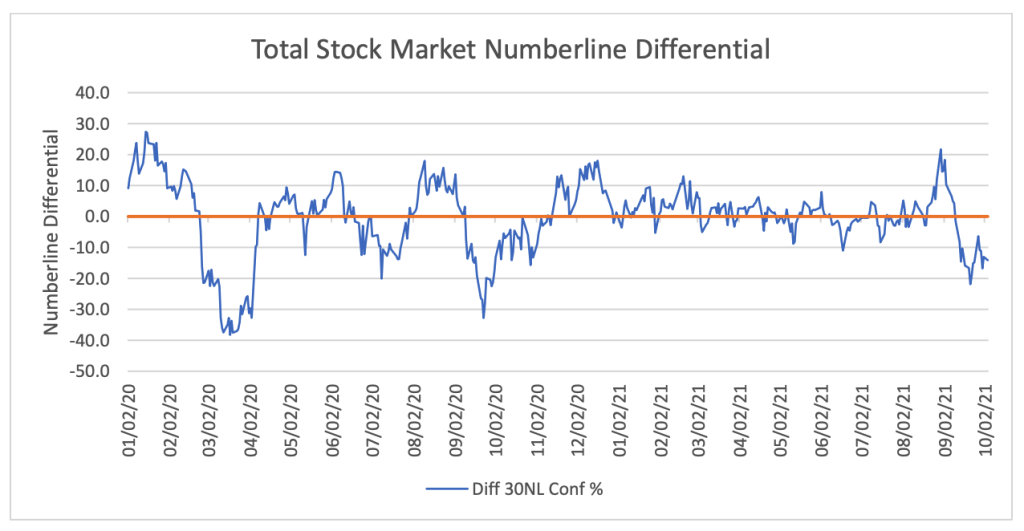
This is where the fire spread from the kitchen. This graph is giving you a very granular look inside the body of the market, think of it as a very comprehensive blood analysis. The spike in late August got us pretty bullish as we finally broke out of that tight range where the market was going back and forth between growth and value trades. But right after we got that spike up, we got an equally sharp spike down and got the most negative reading since the last 5% to 10% correction we had in October last year. As you can see it’s still deeply negative and concerning. There has been some technical damage that will take some time to repair. The market is really focused on rates now. A move above 1.70% on the ten-year will likely lead to another round of selling, especially in tech. We do feel that the small-cap stocks will hold up better in a higher rate environment and we are positioned that way.
Inflation
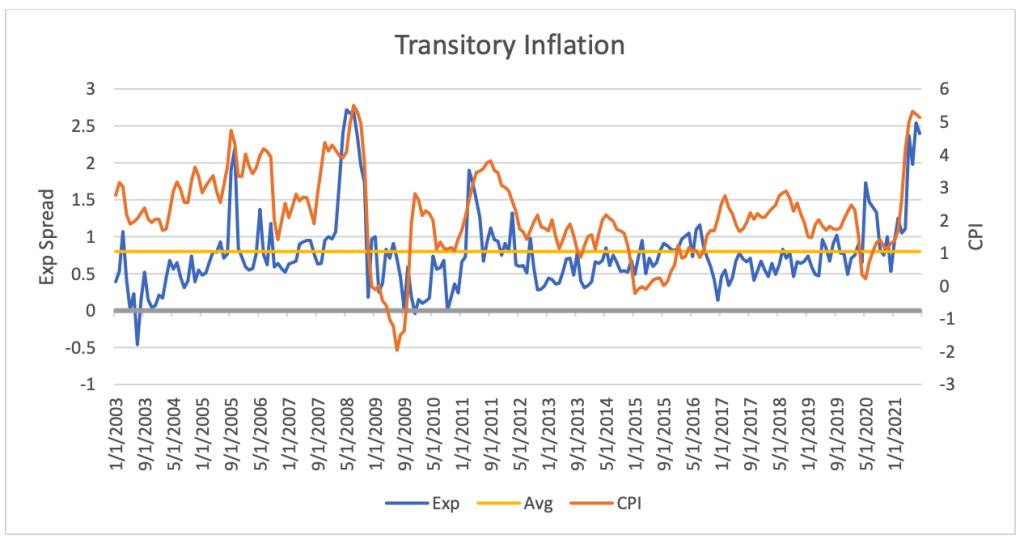
A few months back we showed this chart. There is a lot of important info here. What it’s showing is that the market is still very much in the “transitory inflation” camp. That’s what the blue line is, it’s the spread between a survey of short-term expectations and a market-implied longer-term outlook. Historically the market has been pretty good about getting it right. Spikes in the blue line lead the orange line (CPI inflation) to fall back down. What is important to take away from this is, that is how everyone is positioned. If that does “not” happen, positions will have to be reversed quickly and perhaps violently. This is why the inflation risk and therefore a spike in rates, is probably the biggest risk factor at the moment for risk assets. We will be watching it closely.
Summary
We are getting close to the seasonally strong period that usually comes post-Thanksgiving. But before we get there the market will likely remain volatile. We will be watching the Numberline differentials shown above as well as the vol risk model very closely. There are all sorts of risks out there that are pretty common knowledge at this point; from Washington to oil, to China, and rates. None of these will be surprises, but the velocity of the rate move could be.
Past performance is not necessarily indicative of future results.
Photo by KWON JUNHO on Unsplash