Tag: China

Buying Commodities a Play on China Growth As Well As Inflation
We have previously posted the relationship between global growth and commodity returns as measured by the leading index (BCOM). Global growth above 3% is a good tailwind for overall commodity demand that will push prices higher.
Narrow Ranges Reflect Ample World Supply
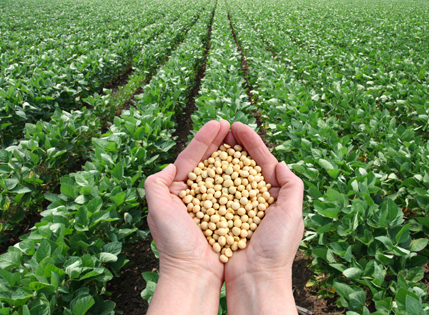
The amplitude of grains and oilseed prices last month was extraordinarily narrow. Soybeans were the most-contained, with a high-to-low closing price range of just 28c in the March contract, narrowest for January since 1998. It’s even more remarkable considering that on the 12th, USDA surprised the trade by reducing the 2015-16 U.S. crop by 50 million bushels. The reason that such stable matching of supply and demand rarely persists for a month is the constant fresh assessments of risks to production of crops in the field and the next to be planted. Today, such is the adequacy of supply and geographic diversification of growing areas that the market judges risk to be lowest in decades.
Commodity Prices and the U.S. Dollar
The chart above plots the performance of the Commodity Research Bureau (CRB) index, a benchmark measuring the prices of 19 diverse commodities. The legend is purposefully omitted so that we may pose the following question: If the lines represent one indicator, why are there 3 lines? The answer lies not in the commodity prices underlying the index, but in the currency used to express the prices. The blue line represents the CRB index as it is commonly expressed, in U.S. dollars (USD). The green line is denominated in euros and the black line in Brazilian reals. This graph highlights that the currency in which a commodity is denominated can have a meaningful effect on prices.